8 min read
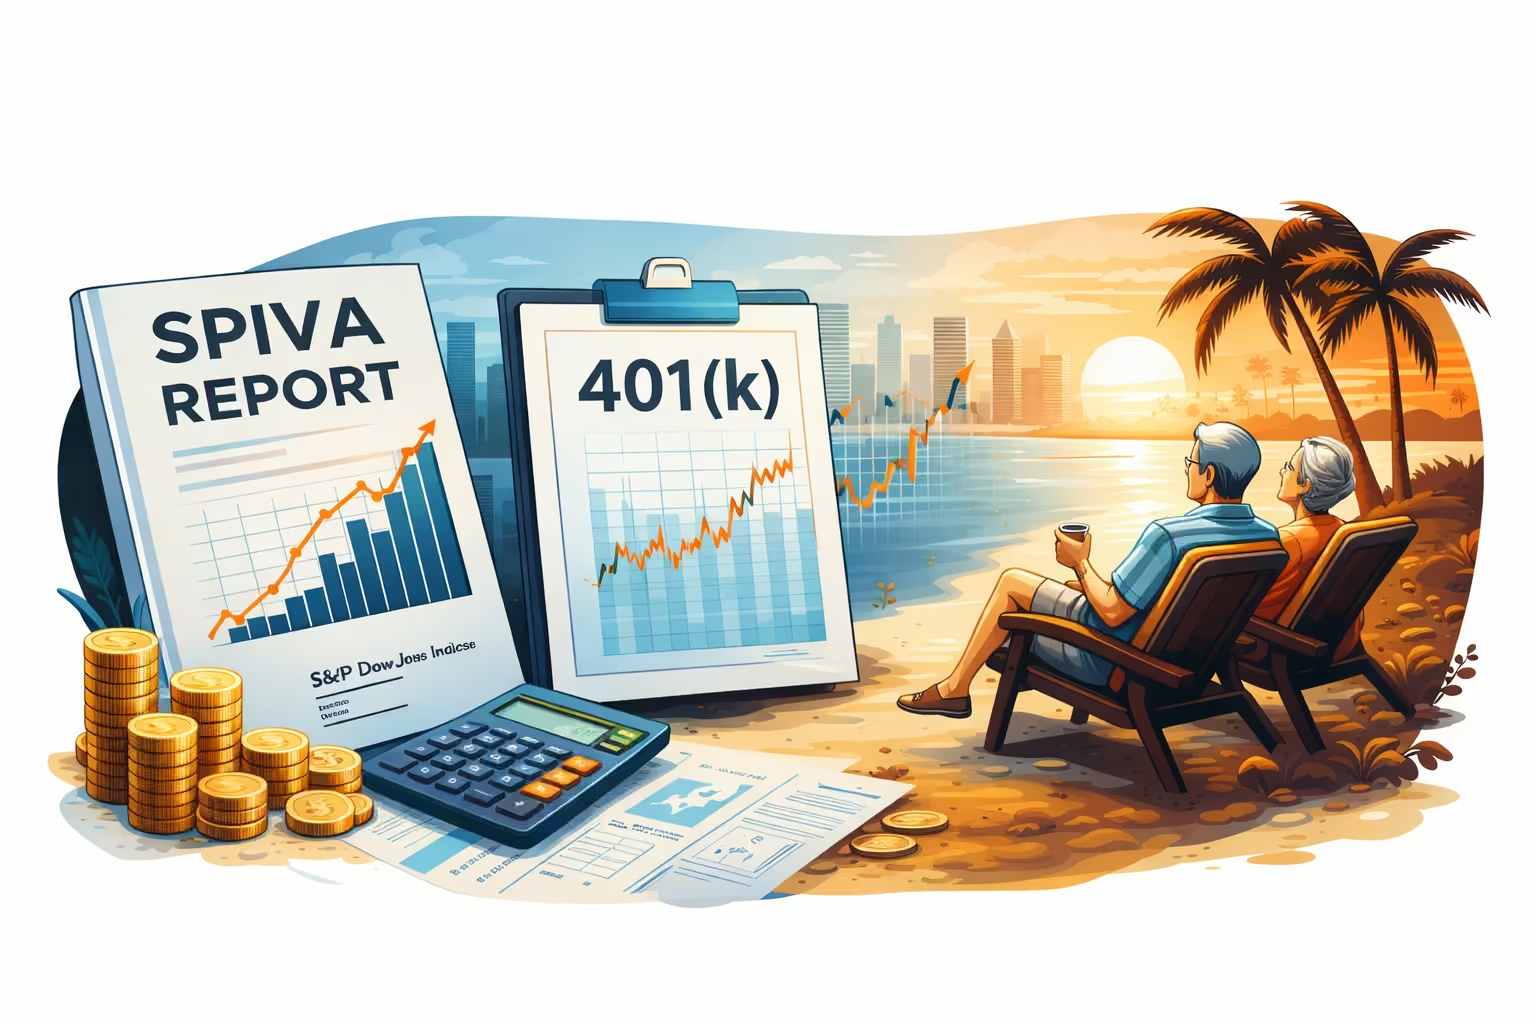
The SPIVA Report: What It Tells You About Investing Your 401(k) for Early Retirement
Share this story
If you’re planning Early Retirement, understanding how to maximize your 401k performance is crucial. One of the most enlightening resources for this is the SPIVA report (S&P Indices vs Active), which compares the performance of actively managed funds to the S&P 500 index for over more than two decades. The findings are clear and eye-opening: Over the long term, index investing beats active management funds after factoring costs..
This article will break down the SPIVA report, show real-dollar examples, and highlight why you shouldn’t trust the Financial Experts who promise superior portfolio returns.
What Is the SPIVA Report and why does it matter?
Active management of stock funds are built on a premise: fund managers with skill can consistently outperform the market . . but history tell us a different story.
Over the past 20 years, S&P Global has released the SPIVA report, comparing actively managed funds to the S&P 500 Index. The report tracks performance across different asset classes, regions, and time frames. Its conclusion is remarkably consistent:
Professional Fund managers fail to consistently outperform the market over time, and once their fees are factored into portfolio outcomes, it’s not even close.
Key SPIVA Findings for 401(k) Investors
The 2024 SPIVA U.S. Scorecard revealed:
- Over the past 5 years, 87% of actively managed funds underperformed the S&P 500, net of fees.
- Even if a fund beats the market in one year, it doesn’t stay in the top quartile consistently—indicating performance is due to luck rather than skill. Sadly no investor can consistently hold on to the top portfolio’s returns.
- Here’s the data:
S&P 500 vs All Large-Cap Fund Returns (2024)
Source: SPIVA U.S. Scorecard – 2024 Report
Real-Dollar Impact on Your 401(k) Portfolio
To put these percentages in perspective, consider the impact to a hypothetical $1M 401(k) portfolio. Given this is a deferred retirement fund, readers might focus on the 15-20 year spread between an S&P indexed portfolio and the alternative of an actively managed fund. Over this timeframe an investor's opportunity cost can run into the millions.
By year 12, choosing actively managed funds will likely cost you over a million dollars, mainly due to management fees averaging 1%+ of assets, and the compounding effect of taking those amounts out of your portfolio year after year.
The larger the portfolio, the larger the costs . . . .:
For larger portfolios, investing in actively managed funds vs indexed funds will potentially cost an investor over a million dollars in just 7 years! Choosing low-cost strategies ensures more of your portfolio stays in your hands—or the hands of your family rather than in the pockets of Wall Street fund managers..
Why Do Active Managers Struggle to Beat the Market
Even the most talented fund managers can’t outperform the index over the long term for two main reasons:
- High Fees Compound Over Time – Typical asset management fees are 1–1.5% of assets annually, which compounds against your returns. These fees are hidden and baked into the results in ever so slightly lower returns most years. But the magic of compounding works against the investor in this case. While the direct management fees are a significant cost, the much larger cost is the compounding effect of removing these assets from the portfolio over time. For example, if you pay 1% fee on an initial portfolio of $1M for 20 years, assuming a market return of 10.35% you’ll pay about $580k in direct cost. However the compounding impact to your portfolio is another $725k, leading to a total portfolio impact of $2,075,572.
- Historically, very few stocks drive market returns – Research from Arizona State University shows that just 4% of stocks created all the wealth in the market over 100 years. This is a very interesting and not well understood phenomena. It’s a small amount of stocks that drive the market, and experts aren’t much better at finding them than you are. The other 96% of stocks that you’ll likely end up in your portfolio collectively match the returns of 1 month T-bill. The mean (average) stock returned 22,840% from 1926 to present. The median (middle) stock returned is negative 7.4% during that same period.
Taken together, these findings paint a clear picture. High fees act as a compounding drag on returns, and the odds of consistently picking the rare stocks that generate nearly all market wealth are vanishingly small—even for seasoned professionals. The SPIVA report confirms what the data has shown for decades: indexing isn’t just a “low-cost alternative,” it’s the strategy that consistently drives the highest returns. For investors and early retirees who want their portfolios to work for them—owning the whole market through low-cost index funds remains the best way to drive high returns.
Fixed 72(t) SEPP Engagement Fee
$799
Click on the below link to begin your engagement and get your 72(t) SEPP plan started today.